Improving IT Project Visibility with Custom ClickUp Dashboards and KPI Reporting
See how an EU Tech company improved IT project visibility with custom ClickUp dashboards, real-time KPI reporting, automated reports, and better resource tracking.
CASE STUDYIT
7/7/20264 min read
Brief Overview
A mid-sized European technology and services company needed better visibility into IT project progress, team productivity, deadlines, and resource utilization. Roadmap Consulting developed custom ClickUp dashboards and a KPI reporting system that brought project performance data into one centralized view. The solution automated reporting, gave managers real-time insights, reduced manual reporting effort by 31%, and contributed to a 26% improvement in adherence to project deadlines.
Client Background
The client is a European company specializing in customer retention, sales promotion, and employee engagement through loyalty and incentive programs.
Its team develops and manages technical solutions that integrate CRM systems, e-commerce platforms, and advanced interfaces.
Because the company manages multiple IT projects and interconnected systems, managers needed reliable information about project progress, task timelines, resource capacity, and team performance.
The Challenge
The company had limited visibility into the performance of its IT projects.
Project and task information existed within its systems, but managers did not have a structured way to turn that information into useful performance insights.
The main challenges included:
Limited project performance data
Managers had difficulty measuring project progress, department productivity, and task completion rates.
Without clearly defined KPIs, it was challenging to determine whether teams were meeting expectations or whether projects required additional support.
Inefficient timeline monitoring
Managers needed a better way to track deadlines, task duration, and project completion.
The existing process did not provide a clear overview of delayed tasks or projects that were at risk of falling behind schedule.
Manual performance reporting
Reports had to be prepared manually.
This required significant administrative effort and meant managers were often reviewing information that was already outdated by the time the report was completed.
Limited visibility into resource utilization
The company needed more reliable information about how resources were distributed across projects.
Without a centralized view, it was harder to identify capacity issues, workload imbalances, or areas where additional support was required.
Disconnected decision-making
Managers lacked a single source of information for project performance.
This made it more difficult to compare projects, identify performance trends, and align IT activities with wider organizational goals.
The Solution
Roadmap Consulting implemented a customized ClickUp setup and KPI reporting system designed around the client’s project management and reporting needs.
The solution focused on four key areas:
Defining measurable project performance indicators
Building custom ClickUp dashboards
Introducing real-time performance monitoring
Automating project reporting
Defining Relevant Project KPIs
The first step was to work with department heads to identify the metrics that were most important for managing IT projects.
The selected key performance indicators included:
Project completion rates
Task completion rates
Task duration
Adherence to deadlines
Project timeline performance
Resource utilization
Department productivity
Workload distribution
These KPIs created a consistent framework for evaluating project and team performance.
Instead of relying on general impressions or manually collected information, managers could review measurable data directly within ClickUp.
Custom ClickUp Dashboard Development
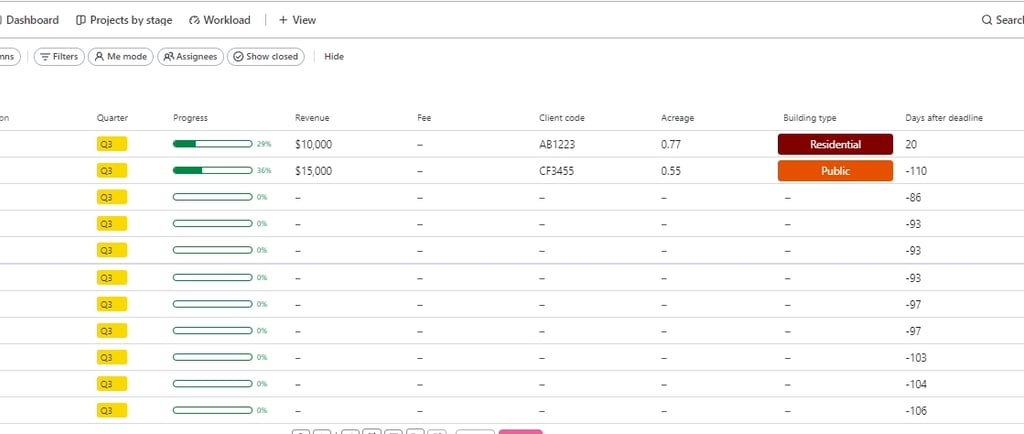
Roadmap Consulting built tailored ClickUp dashboards that displayed the selected KPIs in a visual and accessible format.
The dashboards brought important project data into one centralized view, allowing managers to monitor:
Active projects
Completed and outstanding tasks
Upcoming deadlines
Overdue work
Project completion percentages
Team workloads
Resource allocation
Productivity trends
The dashboards were designed to help managers understand project status quickly without reviewing individual tasks or preparing separate spreadsheets.
Real-Time Project Monitoring
The dashboards were connected to live ClickUp data.
As tasks were updated, completed, reassigned, or delayed, the dashboard information changed automatically.
This gave managers real-time insight into current project conditions and allowed them to respond more quickly when:
Tasks were approaching their deadlines
Projects were falling behind schedule
Team members had excessive workloads
Resources needed to be reassigned
Completion rates were below expectations
Real-time monitoring helped the company move from reactive project management to a more proactive approach.
Automated KPI Reporting
The reporting process was automated within ClickUp.
Instead of manually collecting task data and preparing performance reports, managers could access current information directly through the dashboards.
This reduced the administrative effort required to prepare regular reports and improved the consistency of the information being reviewed.
Automated reporting also ensured that different managers and departments worked from the same data.
Centralized IT Project Management
The solution created a unified system for monitoring IT project performance.
Managers could review progress, productivity, resource usage, task timelines, and deadline adherence within one platform.
This improved transparency across projects and made it easier to align daily project activity with company goals.
Results
31% reduction in manual reporting effort
Automated dashboards and reporting reduced the time spent collecting data and preparing project performance reports by 31%.
This allowed managers and team members to spend more time on project delivery and higher-value work.
26% improvement in deadline adherence
Improved task and timeline monitoring contributed to a 26% increase in adherence to project deadlines.
Managers could identify potential delays sooner and take corrective action before they affected the wider project.
Improved project visibility
Managers gained a real-time overview of project status, task progress, completion rates, and resource utilization.
They no longer needed to review multiple reports or individual task lists to understand current performance.
Better productivity insights
The KPI system provided measurable information about team and department performance.
Managers could identify trends, investigate performance issues, and make more informed operational decisions.
More effective resource planning
Workload and resource data helped managers understand how work was distributed across the team.
This supported better task assignment and reduced the risk of individual team members becoming overloaded.
Faster decision-making
Because project data was available in real time, managers could respond to issues faster.
They were able to adjust priorities, reassign work, and address timeline risks based on current information rather than delayed reports.
Consistent performance reporting
The dashboards created a standardized reporting structure across IT projects.
This made it easier to compare results, monitor progress over time, and maintain consistent performance expectations.
Business Impact
The customized ClickUp dashboards transformed the way the company monitored IT project performance.
The client moved from manual and fragmented reporting to a centralized KPI-driven system that provided real-time project insights.
Managers gained better control over task timelines, project completion, team productivity, and resource utilization. The system reduced reporting effort, improved adherence to deadlines, and supported faster, data-driven decisions.
The new reporting structure also established a scalable foundation for continued project performance management as the company grows and manages more complex technical initiatives.